zthrottle is a from-scratch desktop system-stress and benchmark tool in Rust behind a cyberpunk HUD. It carries four real single-axis benchmarks — storage throughput/IOPS, network throughput/latency, compute, and memory bandwidth/latency — and the contention profiler: the world-first surface that drives every subsystem at once and shows how each one degrades under load from the others, because every benchmark that measures one thing with the rest idle is measuring a machine that never exists in practice. Around the benchmarks sits a full system-monitor suite. It is a thin Tauri v2 shell over the pure-Rust zthrottle-core engine, which owns all benchmark logic, the monitor data harvest, the command surface and the served frontend. Paid product; early-stage and in active development.
Four Benchmarks
Disk sequential + random throughput and IOPS (direct I/O, bypassing the page cache), network throughput and latency, multi-threaded compute, and memory bandwidth + latency — each a real measurement, not a synthetic score.
Contention Profiler
Loads disk, network, CPU and memory simultaneously and reports the interaction matrix — how much each axis degrades under pressure from the others, plus the bottleneck migration timeline. This is the reason the tool exists.
System Monitor
A tabbed monitor: processes (CPU/memory table, CPU-history graph, per-process signal menu — TERM/KILL/STOP/CONT/HUP and more), per-interface network with live download/upload sparklines, and a global storage view.
Storage Tree
A persistent SQLite index of the whole directory tree — instant load on launch, kept accurate by an mtime-diff refresh. Drill in, find the biggest space hogs anywhere (the dirs macOS Storage hides), flag build/cache junk, and delete to reclaim space. SMB/NFS mounts are detected and never walked blind.
The contention idea
A disk benchmark with the CPU idle, a CPU benchmark with the disk idle — four numbers that never happen together. Real workloads saturate several subsystems at once and the interference between them is the number that predicts behaviour. The contention profiler runs every axis concurrently, measures each axis' throughput while the others hammer the machine, and renders the degradation as a matrix plus a bottleneck-over-time timeline.
From measuring to deciding — the contention governor
Every profiler above reports on a run that already happened. plant.identify fits them into one first-order-plus-deadtime model of the machine — a static gain per axis pair from the dose-response sweep, a time constant from the −3 dB contention bandwidth, a deadtime from the step-release trace — and gov.* consumes that fit as a controller. gov.tune synthesizes SIMC constants in closed form from the fitted elements, with no new measurement; gov.admit answers a scheduling question instead of producing a report: how many workers may run on this axis while that one stays above its floor? gov.headroom is the same search rendered as remaining capacity without taking any, gov.report closes a lease with what the machine actually delivered, and gov.ledger reads the record back as a signed verdict on the governor itself — an admission controller that reported only its grants could never be shown wrong.
The decision is made against the machine's outstanding commitments, not against an idle one. Workers held by leases that are still open and unexpired on the requested axis come off the bound before anything is granted, and workers held on the other axes are priced into the QoS feedforward through the model's multi-axis prediction — contention is cross-axis by construction, so evaluating a disk request as though eight outstanding CPU workers were not running would contradict the model the governor is built on. That is what makes the surface safe to hand to processes that have never heard of each other: a make -j, a CI runner, a shell job dispatcher and every other MenkeTechnologies engine on the automation bus all admit against the same ledger, so the sum of their grants is what the plant bounds rather than each grant individually. An unmodelled axis pair fails safe — granted in full and flagged, never throttled against a fit that does not exist.
Running
# from the zthrottle app repo
pnpm install
pnpm --dir app tauri dev      # dev build with hot reload
pnpm --dir app tauri build    # release bundle
Architecture
The GUI is a thin Tauri v2 shell; every calculation lives in zthrottle-core. The engine exposes one dotted command surface (zth_invoke) for benchmarks, and a lock-free worker pool for the monitor data harvest so a minutes-long storage scan never blocks the UI. Because the engine carries the served frontend, the same benchmark and monitor code embeds inside the other MenkeTechnologies apps. See the MenkeTechnologiesMeta umbrella for the wider stack.
The storage index — full scan, then hooks, with a full descent as the reconcile
The persistent directory index is built by a full filesystem walk on first launch (or a wiped DB), streamed to the UI and committed in batches so it survives a mid-walk restart. In steady state the fs-watch hook carries the writes: an FSEvents / inotify watch on $HOME, debounced, drives a targeted update_paths that re-sizes every changed directory (the changed paths are deduped to a set first, so a build's thousands of duplicate events collapse to the distinct dirs that matter — and all of them are updated, not a capped subset) and bubbles the delta up to their ancestors — never a whole-tree re-walk. A target/ built while the app is watching is discovered by re-walking from its nearest already-indexed ancestor. What the hook never saw needs a full descent, because creating repo/target/ moves no mtime above repo and the mtime-incremental walk skips any subtree whose ancestors didn't move — so three paths run one automatically: cold start (builds that happened while the app was closed left no events to replay), burst overflow or dropped events (the lost events are precisely the ones announcing new directories, so an incremental reconcile would recover nothing), and every 10th tick (~20 min) of the degraded loop when the recursive watch can't be established at all, with the intervening ticks staying incremental. On macOS the walk never descends /System/Volumes/Data — the firmlink twin of the canonical tree — so nothing is indexed (or counted) twice, and delete candidates are deduped on the canonical path so junk indexed under either form still surfaces. The GUI reads the index instantly on every open: no scan-on-open, no loading screen. Every other write — refresh, reindex, delete, a junk-pattern edit (one SQL pass, no re-walk), a size freshen — is a button the user pressed, and every recalculation is a visible ⚙ JOBS row: the drawer's size freshen runs as a tree.resize job and each fs-watch burst lands as a tree.update row. The db file is kept honest too: pruned rows only freelist pages in SQLite, so after any complete walk the engine VACUUMs when ≥25% of a ≥40 MB file is dead space, truncates the WAL, and a schema bump vacuums the dropped table away instead of leaving a full-size husk.
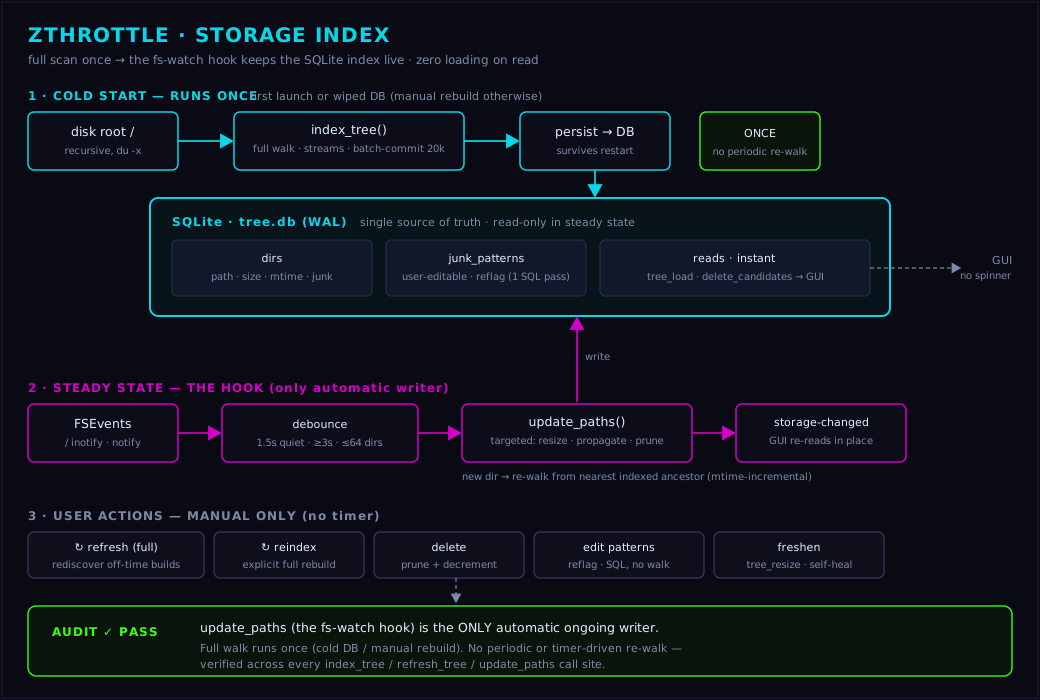
update_paths, with a full descent as the reconcile path on cold start, burst overflow, dropped events, or a watcher that can't start — so the map is always current without a manual re-walk.